Charts
This section explores the diverse visualizations that provide dynamic insights into travel behavior based on your filter selections. The charts offer a detailed analysis of trends, patterns, and distributions, enhancing your understanding of the data.
Chart Outputs
Filter outputs are visualized in the form of bar charts. These include:
Travel Mode
These charts allow users to segment the analysis based on three travel modes. Note that motorized travel captures trips made using both auto and transit.
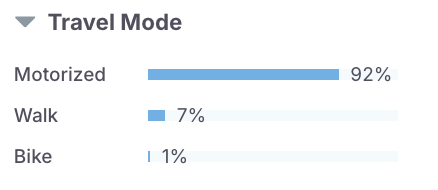
Chart results include:
- Motorized
- Walk
- Bike
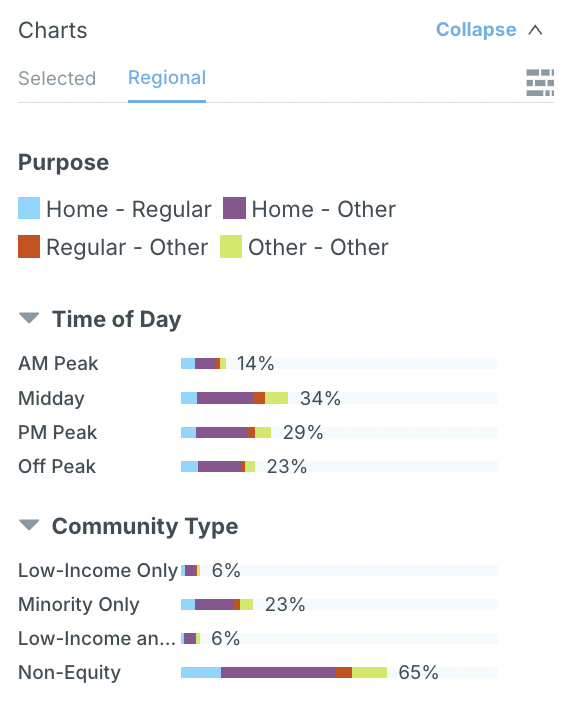
Trip Purpose
This chart allows segmentation of trips into four travel purposes, described below.
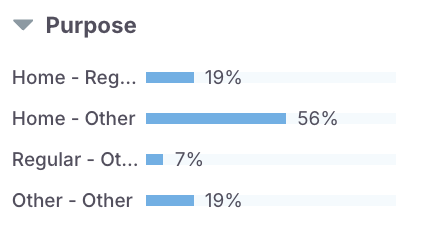
Chart results include:
- Home - Regular: includes trips between home and work/school/college (regularly visited mandatory location).
- Home - Other: includes trips between home and a non-regular location. This may include trips from home to the grocery store, a place of worship, a friend/relative’s home, or to beach/state park.
- Regular - Other: captures trips between the non-home regular location and a non-home location. This captures trips such as going to/from lunch from/to the workplace, stopping on the way back from work to pick up a child from daycare, and/or going to a part-time work location after university classes.
- Other - Other: captures travel between non-home and non-regular locations.
Time of Day
The Time-of-Day chart allows users to view the set of trips across various time periods during the day or at night.
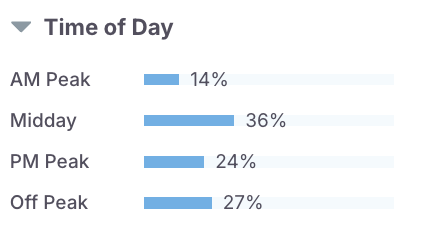
Chart results include:
- Default distribution
- Custom-defined by user
Community Type
The community type is a LOCUS device or transit farecard user-based chart. Community type tags are based on trip ends; if either the origin or the destination of a trip falls under a specific community type group, then that trip is associated with the corresponding community type. The default definitions for these communities represent geographic areas of concerns based on income, equity status, and other socio-demographic attributes if required. If the user specifies their own community type definition, the community type chart will differ based on the information inputted.
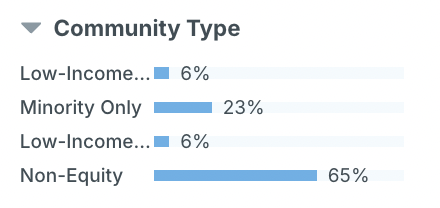
Chart results include:
- Low-income: A device is tagged as belonging to an individual that earns a low income if at least 23% of the associated block group population earned an income in 2021 at or below the poverty level.
- Minority: A device is tagged as being owned by an individual belonging to a minority group if at least 31% of the associated block group population in 2021 belong to minority populations (defined using races including African American, Asian, Native Hawaiian, or other Pacific Islander, American Indian and Alaska Native, or other non-whites as well as those with Hispanic or Latino origin).
- Low-income and Minority: A device associated with a block group that contains both low-income and minority populations.
- Non-equity: All residents that do not fulfil the above are tagged as non-equity. All non-residents are coded under the non-equity group.
- Undefined: Results are not definitively categorized into any of the above.
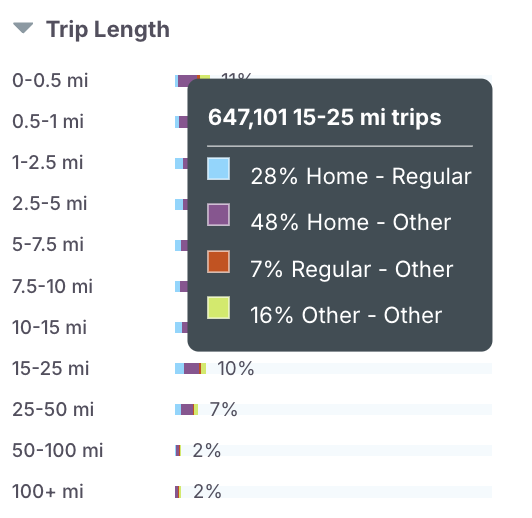
Trip Length
This chart segments trips according to trip length. The trip lengths are the great-circle distances from origin to destination factored by network complexities to represent real-world network distances.
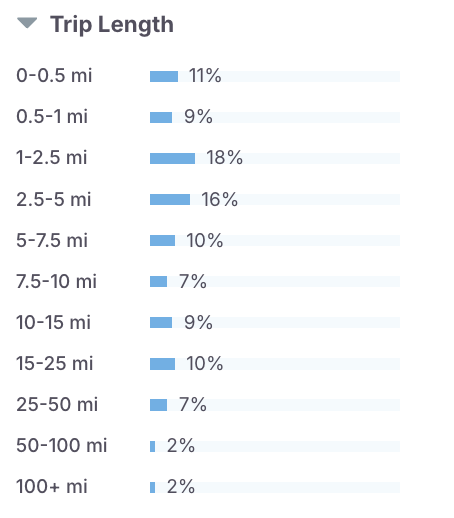
Chart results include:
- 0 – 0.5 mi
- 0.5 – 1 mi
- 1 – 2.5 mi
- 2.5 – 5 mi
- 5 – 7.5 mi
- 7.5 – 10 mi
- 10 – 15 mi
- 15 – 25 mi
- 25 – 50 mi
- 50 – 100 mi
- 100 + mi
Residency Status
This chart reports travel for residents and non-residents, based on whether they reside within the study area or outside of it. Users can conduct analysis for all travelers, or separately for residents and non-residents.
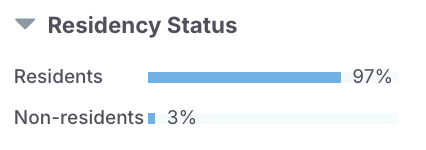
Chart results include:
- Residents
- Non-Residents
Trip End Type
Internal and external trips are classified by trip end type. Any trip end that is outside the trip area is tagged as external.
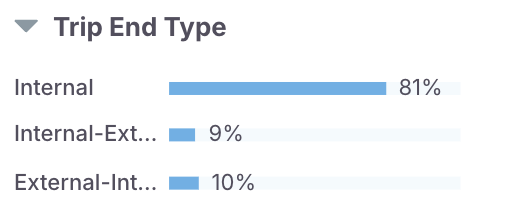
Chart results include:
- Internal: Both origin and destination end within the study area.
- Internal-External: Origin inside study area, destination outside study area
- External-Internal: Origin outside study area, destination within study area
Further Analysis
Numerical Metrics
Hover over charts for specific numerical metrics for each category.
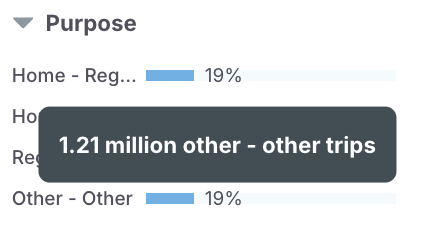
Chart Segmentation
Segment charts by trip length, travel mode, time of day, residency status, trip end type, travel purpose, period, day of week, and community type.
Hover over each chart for more detailed metrics about the corresponding category.
Charts for Selected Areas
Utilize charts for comparative analysis, comparing different filter selections to identify trends and variations. When a specific area is selected using the map selection tool, which will be discussed in the subsequent section, clicking on the “Selected” tab in the Charts panel will reveal metrics specific to the area highlighted on the map.