Data and Methodologies: Frequently Asked Questions
Data Description
1. What are location-based services (LBS) data?
Location-based services data are timestamped geolocation data generated by smartphone applications where users have explicitly granted permissions for the application to track geolocations. This data can be generated in the foreground (when the application is turned on) or the background (location information shared even when application is not actively used). LBS data are GPS-driven and therefore spatially very accurate. Our processed data are delivered through our LOCUS product line.
2. How does LOCUS ensure data privacy in the development of LOCUS trip tables?
The data obtained by LOCUS cannot be linked to a cell phone number or an individual. We use data from apps where people have explicitly opted in for location tracking, and we work only with vendors who employ rigorous standards to safeguard personally identifiable information. Further, any data distributed through our licenses are aggregated across spatial and temporal dimensions to add an additional layer of privacy protection before we share the data with our partners and clients. Privacy is our priority - whenever there is a choice to be made between privacy and accuracy, we have always and will continue to choose privacy.
3. What is the standard geographic scale/resolution?
While the raw data is collected using GPS technology and is spatially very accurate, our standard products include Census Block Group level detail for origin-destination flows. Based on the needs of a study, we allow and can provide custom zone selection, but we require that zone sizes be large enough to protect privacy and also to avoid small sample sizes. Whenever examining the data at fine spatial resolutions, we always look at sample sizes to determine the level of detail that the data can support. We will not provide fine-grained spatial data if the data are too limited.
4. Does the data screen out minors? For example, the data from devices registered to minors is not supposed to be tracked.
Our vendor follows all applicable laws and standards relevant to data tracking, aggregation, privacy and anonymization.
5. What is the sample size of the LBS data?
Very large – we often start with a sample that is 60-80% of the state or region’s population each quarter. But all devices are not equal, in terms of quality and quantity of data. After applying rigorous analytics that retain only the most robust devices, we end up with an enriched sample of about 6-10% of the population. Importantly, each device has multiple days of data per quarter allowing us to capture many trips made in the state and thereby capturing a lot of heterogeneity in travel patterns. Compare this to typical household surveys which capture less than 0.1% of the population and only 1-2 days of travel information.
6. What are the known biases in the data samples? For example, does the data skew towards higher incomes?
We have examined our expansion weights by census tract and correspondingly looked at census tract demographics to determine if there is any correlation between demographics and penetration rates in our sample. We have not found any in most locations. However, this is something we monitor for each new client to ensure data quality. It should be noted that because we do not capture any user demographic information, our checks do not necessarily mean that biases do not exist; however, based on our expansion rate calculations, we believe that any biases that exist are not systemic.
7. How are the LBS data representative of regional population and therefore, regional travel patterns?
Although we do not have information on individual device owners (due to the privacy protection protocols), we work with our vendors to ensure that the data are derived from both Android and Apple operating systems and from a broad spectrum of apps - multilingual, lifestyle, travel, dating, weather, gaming, and news (of all political leanings). We also perform data penetration and data quality checks at different Census geographies. More specifically, here are answers to questions that our clients have asked us:
- Does the data represent low-income population? We believe so, because in most cases, low-income earners use smartphones as their primary computing device. A study by Pew Research indicates that the smartphone penetration for low-income population (less than $30,000) is 76%, which is comparable to overall market penetration of smartphones (85%).
- Does the data represent non-English speakers? Yes, because the data are derived from apps that feature content in multiple languages (English and Spanish, amongst others).
- Does the data represent respondents of all ages? Not always, groups that have lower smartphone penetration rates (61%) such as the elderly (65+) are likely not captured in this sample.
- Does the data represent people with disabilities? We are not sure, since we have no information about the demographics of individual device owners. To the extent that individuals with disabilities are able to operate and use smartphones, we believe that our data does capture their travel patterns.
8. How is the sample size changing over time? If so, how does this influence the data outputs?
Over the past couple of years, there have been several market drivers at play which have affected the quality of location-based services data, which include enhanced data privacy controls for end-users (both Apple and Android), increased regulations and compliance requirements, and consolidation of vendors in the data aggregation space.
To ensure we always provide the highest quality of data products and ensure continuity in our outputs (to allow trends over time) that our users can consistently rely on, we proactively monitor and adjust our incoming LBS data streams, build our products using only the most robust devices with the highest quality of data (thus reduce the impact of fluctuations and low-yield devices in the raw data), deploy consistent processing and expansion algorithms, and conduct thorough and regular data validation/calibration using national, regional, and local data sources.
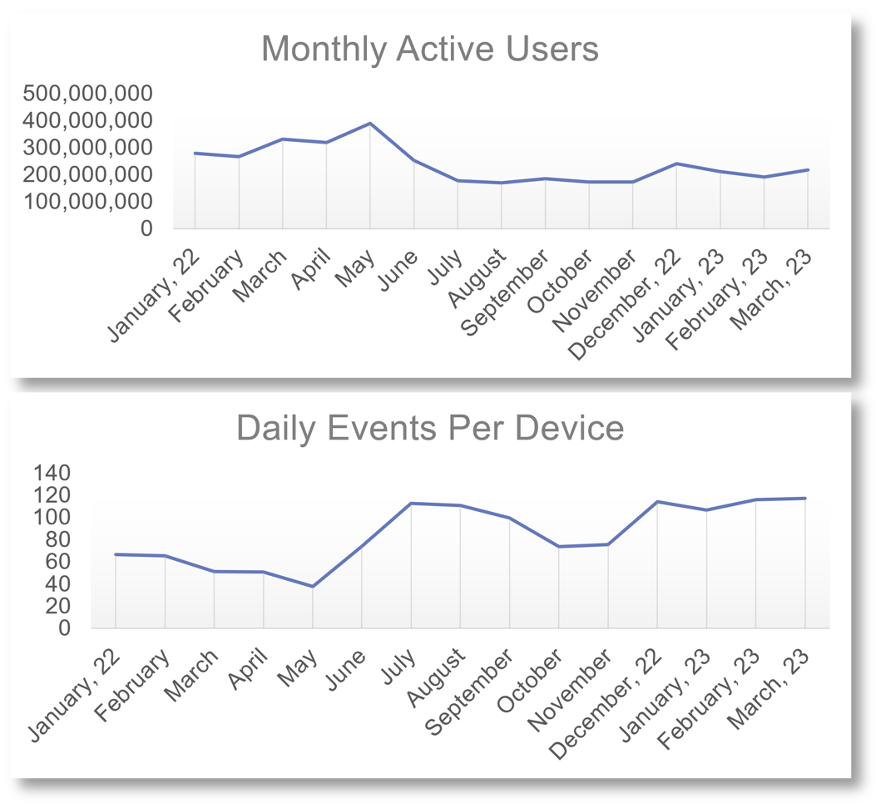
The figure below show the changes in our data streams between 2022 and 2023 – there is a drop around the iOS changes on data sharing across apps in June 2022, but our data streams have since stabilized, with increase in the daily events per device. Our penetration rate with the valid devices (with the most robust data) in 2023 was between 6-10% of the total population.
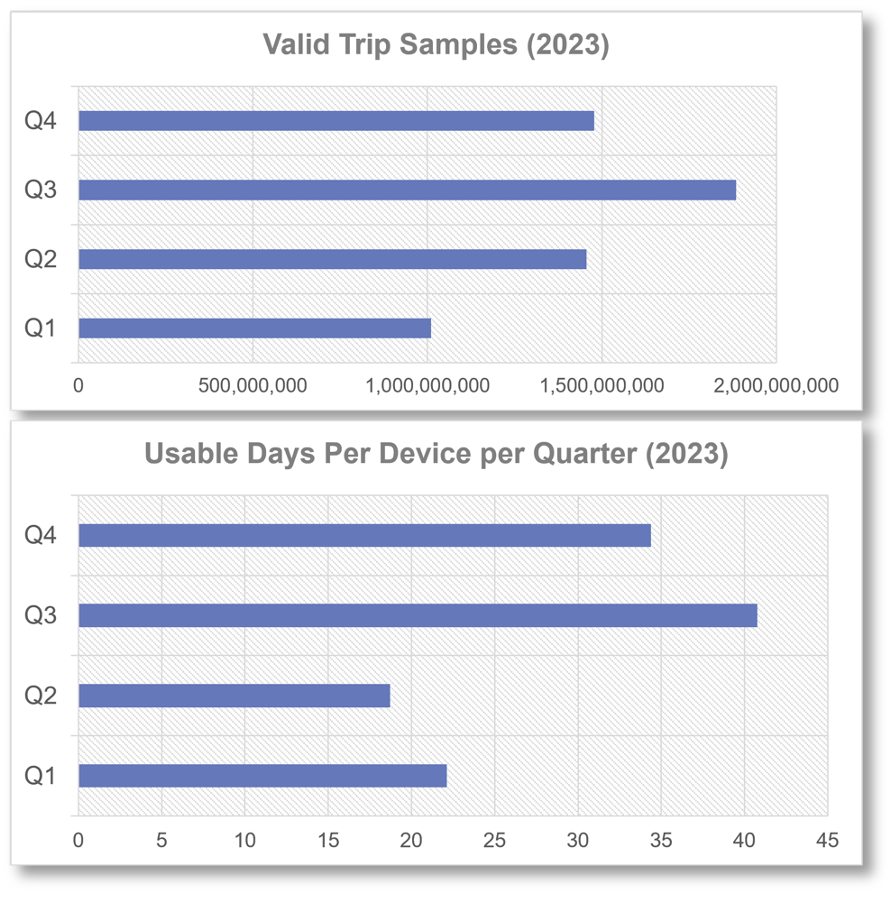
The next figure shows the trips and usable days per valid device per quarter in 2023. On average, we get between 20 and 40 days of rich travel information per device, allowing us to build high-quality movement analytics.
Data Processing, Expansion and Validation
1. What are the key steps in processing LBS data for person travel?
There are four key steps in processing LOCUS data:
- Identifying stops (activity stays) in the LBS data streams
- Imputing home and regular (work/school) locations
- Determination of trip purpose and mode inference (walk/bike/motorized)
- Expansion
2. How are stops (activity stays) and trips extracted?
The raw LBS samples/trajectory events are first processed and filtered to extract stops (activity stays), which represent a device in stationary state (as opposed to trajectory state, where the device is in motion). These visit events are then clustered to transform consecutive visits into longer “activity stay” observations, which represent a device’s engagement in an activity (such as work, school, shopping, etc.). These records are cleaned further by checking for unreasonable speeds between stays. Stays were filtered if they did not meet a minimum stay duration criteria (10 mins) – however, this condition is relaxed under certain conditions to allow for shorter stops based on deviation from the straight-line path between stops immediately preceding and following the stop (such as a drop-off event). Once activity stays were identified, trips are inferred from the data by connecting consecutive activity stays completed by the same device.
3. How is the data expanded?
The main control data sources used in the expansion process are ACS population and national estimates for employment and school enrolment at a Census Tract Level. Our processed data are expanded at the device level to replicate the state population (age 10-85) at the home-end. We apply a bivariate expansion process which also controls for employment and school enrollment at the regular location end.
Once the device-level expansion is complete, we apply two scaling factors: the first one is done to normalize trips produced by each device since each device produces differential volumes of data; the second one is to done to adjust for short-trips which are often under-represented in the data because of sample biases and misidentification of short trips (with short durations of stay). Because of our comprehensive expansion, the outcome of the expansion process are average daily estimates of person travel (instead of a “score” or “index”).
This expansion process also eliminates devices with poor quality of data, thereby allowing us to eliminate sample biases that result from the variability in the quantity of data collected from different devices, similar to the process we undertake in a household travel survey.
4. What the mode options available in LOCUS data?
By default, LOCUS data captures three modes – walk, bike, and motorized. Our mode inference relies on advanced behavioral models, drawing on Cambridge Systematics’ decades of travel behavior and modeling expertise, that incorporate a multitude of features - ambient travel conditions (such as weather and daylight), elevations and gradients, land-use and built-environment characteristics, detailed network characteristics, trip characteristics (such as length).
For many transit agencies, including LA Metro, WMATA, King County Metro, and OCTA – we have integrated expanded APC/farecard data summaries within LOCUS to provide more detailed and realistic measures of transit usage.
5. How is equity incorporated into the travel data?
Based on the home location of devices, we are able to assign whether or not the devices reside in equity-focused communities. Since this is a home-based label, all trips made by the residents of equity communities are tagged with the label, allowing for a comprehensive assessment of equity travel.
This is highly customizable, and we are happy to integrate our clients’ definitions of what their equity-focused communities are. This has helped numerous agencies better understand the travel patterns of their equity focused community residents and organize their transit service and/or prioritize safety solutions.
6. What trip purposes are available in the data?
We offer four trip purposes - home-regular (work, school, college), home-other, regular-other, other-other.
7. How are the LBS trip patterns validated?
We have invested significant time and resources to develop our detailed and rigorous expansion and validation methods for LOCUS person travel. We perform data validation at both the national level and regional level by comparing travel patterns observed in LOCUS against National Household Travel Survey (NHTS) and regional/local travel surveys, respectively.
We evaluate our results across key dimensions such as trip rates, time-of-day distributions, trip length distributions, and modal splits. We also build a broad spectrum of sensibility checks on our results such as: active mode shares in universities, seasonal changes in walk/bike shares (e.g. lower shares in cold weather); trip purpose and activity durations by land-use types (e.g. CBD vs airport vs residential areas).
We also account for known differences – for example, we observed that the LOCUS data captures more evening/night travel compared to survey data – which is to be expected since respondents in surveys sometimes neglect to capture non-regular travel that occurs at non-regular hours. Since the pandemic, we have relied less on matching against national data sources because the travel patterns across the country have been quite different due to differential stay-at-home requirements and recovery of commuting patterns.
We take great pride in the quality of the work we have put in for data expansion and testing. That said, it is possible that there may be instances where our data does not meet on-ground patterns. We work closely with our clients to help address challenges as they arise. We have worked with several discerning clients – including several modeling teams from Caltrans, Colorado DOT, SEMCOG, NYMTC, and NYMTC; as well as agencies that are relying on our data to make billion-dollar investments such as LA Metro and Florida Department of Emergency Management. To this date, no client has asked us to make edits to the data that we have provided to them.
8. Do you have any additional literature available?
Our approach is driven by the NCHRP report on using cellphone data for transportation which we co-authored with MIT.