Charts
This section explores the diverse visualizations that provide dynamic insights into travel behavior based on your filter selections. The charts offer a detailed analysis of trends, patterns, and distributions, enhancing your understanding of the data.
Chart Outputs
Filter outputs are visualized in the form of bar charts. These include:
Vehicle Class
These charts allow users to segment the analysis based on vehicle class, including medium and heavy trucks.
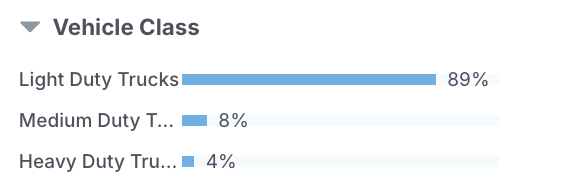
Chart results include:
- Light Duty Trucks: Classes 1-2 trucks that have gross vehicle weight less than 10,000 lbs. Includes service trucks and multi-purpose vehicles doing last-mile deliveries.
- Medium Duty Truck: Class 3- 6 trucks that weigh between 10,001 and 26,000 lbs inclusive.
- Heavy Duty Truck: Classes 7-8 trucks that weigh more than 26,000 lbs.
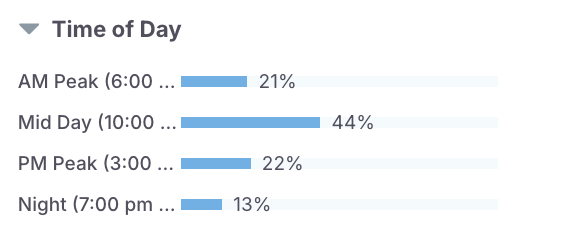
Time of Day
The Time-of-Day chart allows users to view the set of trips across various time periods during the day or at night.
Vocation
This chart segments trips according to the vocation, or type of job, being performed by the vehicle.
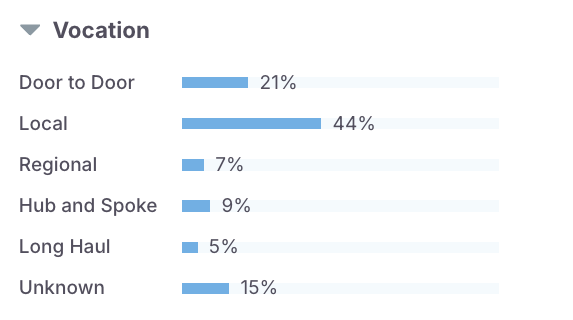
Chart results include:
- Door to Door: The vehicle makes significantly more stops than most per workday, but also tends to spend very little time per stop. Examples include last mile delivery and waste collection.
- Local: The vehicle's range of activity is below 150-air-miles (regardless of miles traveled), thus qualifies for the short-haul exemption under Hours of Service Regulations. This is measured over a given 3-month period. In addition, the vehicle does not exhibit behavior in line with other vocations, such as hub-and-spoke and door-to-door. Examples include HVAC and beverage distribution.
- Regional: The vehicle has a wide range of activity, over the 150-mile threshold for short-haul exemption, but tends to rest in the same location often. The vehicle is also neither hub-and-spoke nor door-to-door. Examples include building supplies and fuel carriers.
- Hub and Spoke: The vehicle spends many of its work days making multiple round trips from a singular location (a centralized hub). Typically, the vehicle would average over one round trip per working day, with these round trips accounting for the majority of its total mileage. Examples include on-demand services or delivery and auto-parts delivery.
- Long Haul: The vehicle has a very large range of activity and typically does not rest in the same location. The vehicle is also neither hub-and-spoke nor door-to-door. Examples include freight long haul, rental, or company vehicles.
- Unknown: Number of trips for which vocation is unknown
Trip End Type
This chart segments trips according to the trip end type.
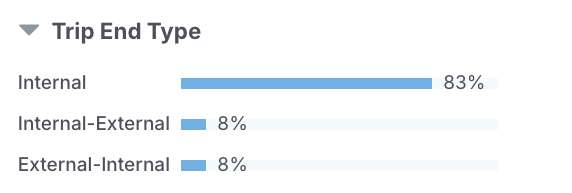
Chart results include:
- Internal: The entirety of the trip takes place within the user-defined study area.
- Internal-External: The trip begins within the bounds of the study area and ends outside of the study area.
- External-Internal: The trip begins outside of the study area and ends within the bounds of the study area.
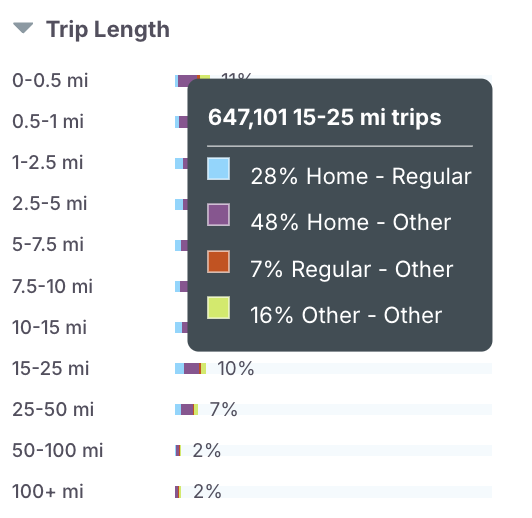
Trip Length
This chart segments trips according to trip length. The trip lengths are the great-circle distances from origin to destination factored by network complexities to represent real-world network distances.
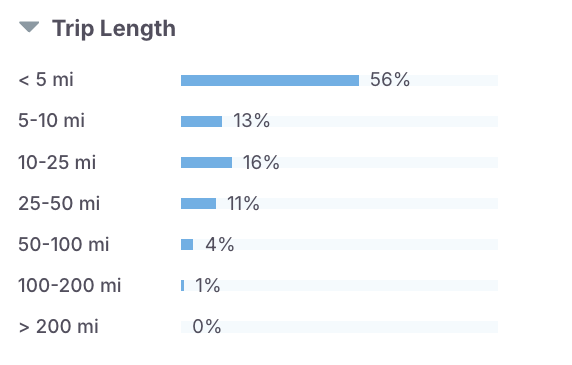
Chart results include:
- Less than 5 miles
- 5 – 10 mi
- 10 – 25 mi
- 25 – 50 mi
- 50 – 100 mi
- 100 – 200 mi
- More than 200 miles
Trip Duration
This chart reports data based on the duration of trips, enabling you to analyze patterns for short or long-distance travel.
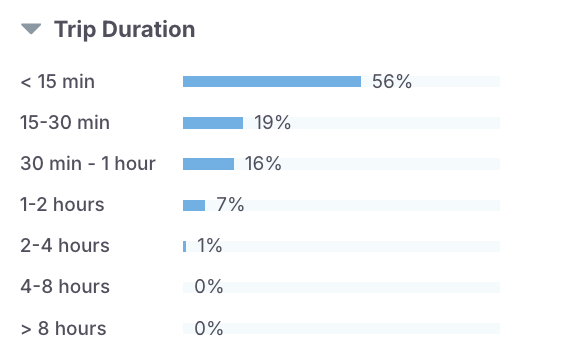
Chart results include:
- Less than 0.25 h
- 0.25 – 0.5 h
- 0.5 – 1 h
- 1 – 2 h
- 2 – 4 h
- 4 – 8 h
- Greater than 8 h
Post Trip Stop Duration
These charts reveal data based on the how long trucks remain stationery at the destination after a trip has ended.
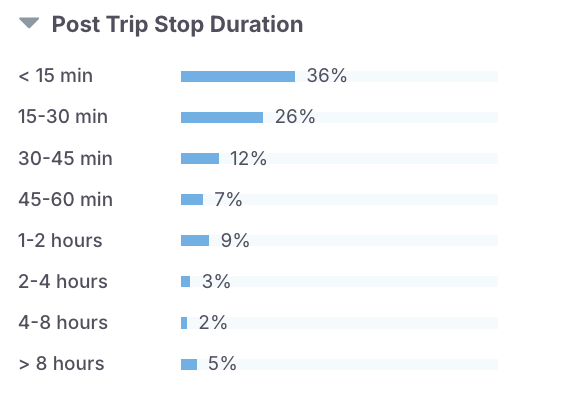
Chart results include:
- Less than 15 min
- 15 – 30 min
- 30 – 45 min
- 45 – 60 min
- 1 – 2 h
- 2 – 4 h
- 4 – 8 h
- Greater than 8 h
Industry
Industry charts reveal travel patterns by filtering data based on the industry that pertains to the trip.
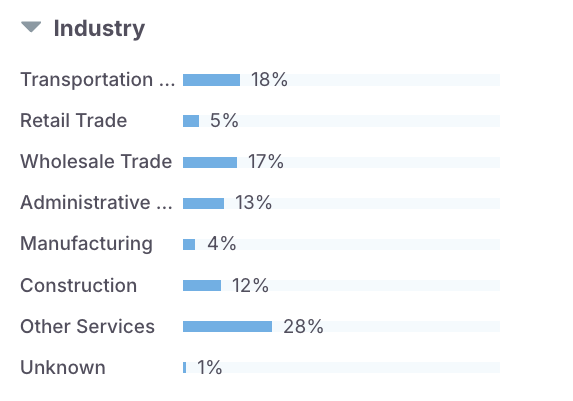
Chart results include:
- Transportation and Warehousing
- Retail Trade
- Wholesale Trade
- Administrative and Support and Waste Management and Remediation Services
- Manufacturing
- Construction
- Other Services
- Unknown
Community Type
The community type is a LOCUS device or transit farecard user-based chart. Community type tags are based on trip ends; if either the origin or the destination of a trip falls under a specific community type group, then that trip is associated with the corresponding community type. The default definitions for these communities represent geographic areas of concerns based on income, equity status, and other socio-demographic attributes if required. If the user specifies their own community type definition, the community type chart will differ based on the information inputted.

Chart results include:
- Low-income Only
- Minority Only
- Low-income and Minority
- Non-equity
Study Period
This chart reveals data about the study period selected for your analysis.

Further Analysis
Numerical Metrics
Hover over charts for specific numerical metrics for each category.
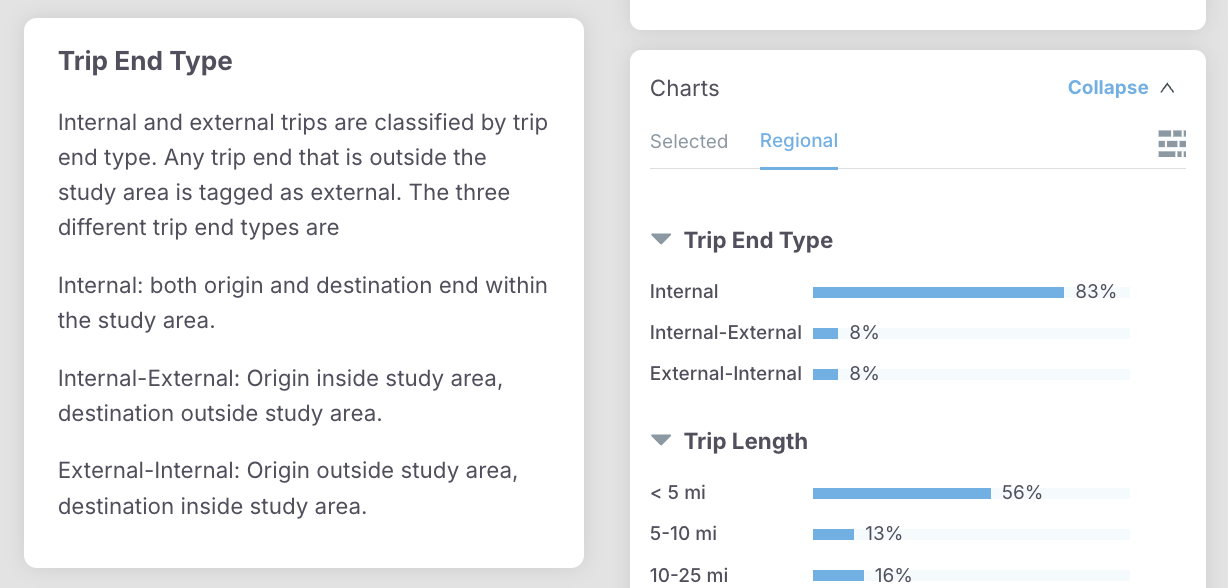
Chart Segmentation
Segment charts by time of day, vehicle class, vocation, community type, and trip end type. The below example shows charts segmented by time of day.
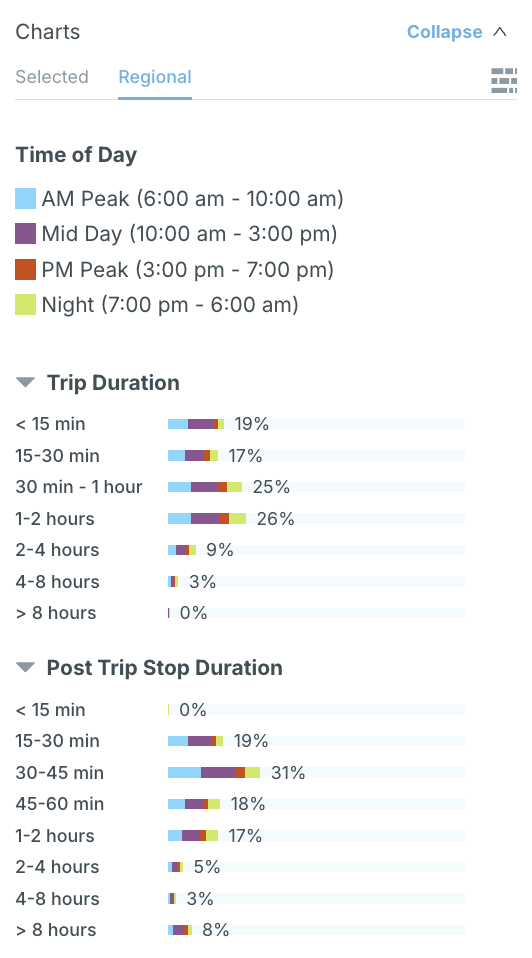
Hover over each chart for more detailed metrics about the corresponding category.
Charts for Selected Areas
Utilize charts for comparative analysis, comparing different filter selections to identify trends and variations. When a specific area is selected using the map selection tool, which will be discussed in the subsequent section, clicking on the “Selected” tab in the Charts panel will reveal metrics specific to the area highlighted on the map.